Difference between revisions of "Figure 4.20: Simulation of the predator-prey system"
Jump to navigation
Jump to search
| Line 46: | Line 46: | ||
# Plot the results | # Plot the results | ||
fbs.figure('mlh') # FBS conventions | fbs.figure('mlh') # FBS conventions | ||
| − | plt.plot(sim.time, sim.states[0], 'b-') | + | plt.plot(sim.time, sim.states[0], 'b-', label="Hare") |
| − | plt.plot(sim.time, sim.states[1], 'r--') | + | plt.plot(sim.time, sim.states[1], 'r--', label="Lynx") |
| + | plt.legend() | ||
plt.xlabel("Time $t$ [years]") | plt.xlabel("Time $t$ [years]") | ||
plt.ylabel("Population") | plt.ylabel("Population") | ||
Revision as of 23:39, 28 May 2023
| Chapter | Examples |
|---|---|
| Figure number | 4.20 |
| Figure title | Simulation of the predator–prey system |
| GitHub URL | https://github.com/murrayrm/fbs2e-python/blob/main/figure-4.20-predprey ctstime.py |
| Requires | python-control, |
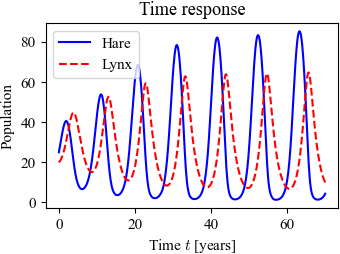
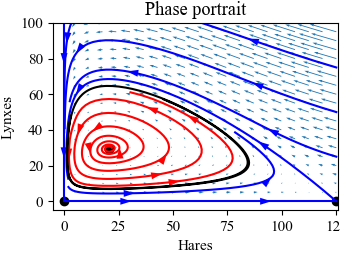
Figure 4.20: Simulation of the predator–prey system. The figure on the left shows a simulation of the two populations as a function of time. The figure on the right shows the populations plotted against each other, starting from different values of the population. The oscillation seen in both figures is an example of a limit cycle. The parameter values used for the simulations are a = 3.2, b = 0.6, c = 50, d = 0.56, k = 125, and r = 1.6.
# predprey_ctstime.py - Predator-prey model in continuous time
# RMM, 28 May 2023

import matplotlib.pyplot as plt
import numpy as np
import control as ct
import fbs                      # FBS plotting customizations

# Define the dynamis for the predator-prey system (no input)
def predprey_update(t, x, u, params={}):
    """Predator prey dynamics"""
    r = params.get('r', 1.6)
    d = params.get('d', 0.56)
    b = params.get('b', 0.6)
    k = params.get('k', 125)
    a = params.get('a', 3.2)
    c = params.get('c', 50)

    # Dynamics for the system
    dx0 = r * x[0] * (1 - x[0]/k) - a * x[1] * x[0]/(c + x[0])
    dx1 = b * a * x[1] * x[0] / (c + x[0]) - d * x[1]

    return np.array([dx0, dx1])

# Create a nonlinear I/O system
predprey_sys = ct.NonlinearIOSystem(predprey_update, states=2)

# Simulate a trajectory leading to a limit cycle
timepts = np.linspace(0, 70, 500)
sim = ct.input_output_response(predprey_sys, timepts, 0, [25, 20])

# Plot the results
fbs.figure('mlh')                                       # FBS  conventions
plt.plot(sim.time, sim.states[0], 'b-', label="Hare")
plt.plot(sim.time, sim.states[1], 'r--', label="Lynx")
plt.legend()
plt.xlabel("Time $t$ [years]")
plt.ylabel("Population")
plt.title("Time response")

# Save the figure
fbs.savefig('figure-4.20-predprey_ctstime-sim.png')     # PNG for web

# Generate a phase portrait
fbs.figure('mlh')                                       # FBS  conventions
def pp_ode(x, t):
    return predprey_update(t, x, 0, {})
ct.phase_plot(pp_ode, [0, 60, 7], [0, 50, 6])
ct.phase_plot(pp_ode, [0, 60, 7], [60, 100, 4])
ct.phase_plot(pp_ode, [70, 120, 6], [0, 50, 6])
ct.phase_plot(pp_ode, [70, 120, 6], [60, 100, 4])

# Plot the limit cycle
ct.phase_plot(pp_ode, X0=sim.states[:, -1:].T, T=20)    # limit cycle
ct.phase_plot(pp_ode, X0=[[120, 32], [120, 60]], T=20)  # outside trajectories
ct.phase_plot(pp_ode, X0=[[19, 30]], T=75)              # inside trajectories

# Label the plot
plt.axis([-1, 120, -1, 100])
plt.xlabel("Hares")
plt.ylabel("Lynxes")
plt.title("Phase portrait")
fbs.savefig('figure-4.20-predprey_ctstime-pp.png')      # PNG for web

