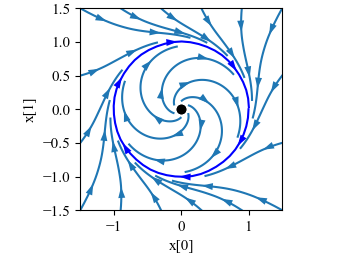
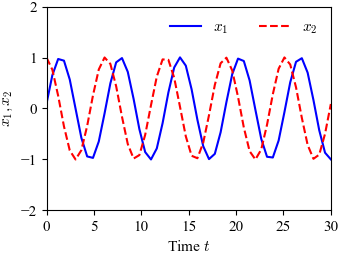
Figure 5.5: Phase portrait and time domain simulation for a system with a limit cycle
| Chapter | Dynamic Behavior |
|---|---|
| Figure number | 5.5 |
| Figure title | Phase portrait and time domain simulation for a system with a limit cycle |
| GitHub URL | https://github.com/murrayrm/fbs2e-python/blob/main/figure-5.5-limit cycle.py |
| Requires | python-control |
Figure 5.5: Phase portrait and time domain simulation for a system with a limit cycle. The phase portrait (a) shows the states of the solution plotted for different initial conditions. The limit cycle corresponds to a closed loop trajectory. The simulation (b) shows a single solution plotted as a function of time, with the limit cycle corresponding to a steady oscillation of fixed amplitude.
<nowiki>
- limit_cycle.py - nonlinear oscillator (limit cycle) phase plot
- RMM, 6 Apr 2024
import matplotlib.pyplot as plt import numpy as np from math import pi import control as ct import control.phaseplot as pp import fbs # FBS plotting customizations
def oscillator_update(t, x, u, params):
   return [
       x[1] + x[0] * (1 - x[0]**2 - x[1]**2),
       -x[0] + x[1] * (1 - x[0]**2 - x[1]**2)
   ]
oscillator = ct.nlsys(oscillator_update, states=2, inputs=0, name='oscillator')
fbs.figure() ct.phase_plane_plot(oscillator, [-1.5, 1.5, -1.5, 1.5], 0.9) pp.streamlines(
   oscillator, np.array(0, 0), 1.5,
   gridtype='circlegrid', gridspec=[0.5, 6], dir='both')
pp.streamlines(
oscillator, np.array(1, 0), 2*pi, arrows=6, color='b')
plt.gca().set_aspect('equal') fbs.savefig('figure-5.5-limit_cycle-pp.png')
fbs.figure() plt.axis([0, 30, -2, 2]) timepts = np.linspace(0, 30) response = ct.input_output_response(oscillator, timepts, 0, [0.1, 1]) plt.plot(response.time, response.outputs[0], 'b', label="$x_1$") plt.plot(response.time, response.outputs[1], 'r--', label="$x_2$") plt.xlabel("Time $t$") plt.ylabel("$x_1, x_2$") plt.legend(loc='upper right', ncols=2, frameon=False) fbs.savefig('figure-5.5-limit_cycle-time.png') <nowiki>

