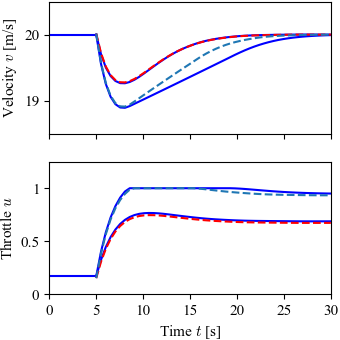
Figure 6.14: Linear versus nonlinear response for a vehicle with PI cruise control
Jump to navigation
Jump to search
| Chapter | Linear Systems |
|---|---|
| Figure number | 6.14 |
| Figure title | Linear versus nonlinear response for a vehicle with PI cruise control |
| GitHub URL | https://github.com/murrayrm/fbs2e-python/blob/main/figure-6.14-cruise linearized.py |
| Requires | python-control |
Figure 6.14: Simulated response of a vehicle with PI cruise control as it climbs a hill with a slope of (smaller velocity deviation/throttle) and a slope of ◦ (larger velocity deviation/throttle). The solid line is the simulation based on a nonlinear model, and the dashed line shows the corresponding simulation using a linear model. The controller gains are and and include anti-windup compensation (described in more detail in Example 11.6).
# cruise_linearized.py - linear versus nonlinear response, cruise w/ PI
# RMM, 20 Apr 2024

import matplotlib.pyplot as plt
import numpy as np
import control as ct
import fbs                      # FBS plotting customizations

# System definition
from cruise import vehicle_dynamics as vehicle

# Figure out the equilibrium point for the system at 20 m/s
xe, ue = ct.find_eqpt(vehicle, 20, u0=[0, 4, 0], iu=[1, 2], y0=20, iy=[0])

# Linearized dynamics
vehicle_lin = vehicle.linearize(xe, ue)

# Controller: PI + antiwindup
ctrl_params = {'kp': 0.5, 'ki': 0.1, 'kaw': 2}

def ctrl_update(t, x, u, params):
    e = u[1] - u[0]                     # v - vref
    v_nom = -params['kp'] * e + x[0]    # nominal control input (PI)
    v_sat = np.clip(v_nom, 0, 1)        # clipped control input
    return -params['ki'] * e + params['kaw'] * (v_sat - v_nom)

def ctrl_output(t, x, u, params):
    e = u[1] - u[0]                     # v - vref
    v_nom = -params['kp'] * e + x[0]    # nominal control input (PI)
    v_sat = np.clip(v_nom, 0, 1)        # clipped control input
    return v_sat

ctrl = ct.nlsys(
    ctrl_update, ctrl_output, states=1, name='ctrl',
    inputs=['vref', 'v'], outputs='u', params=ctrl_params)

# Figure out the equilibrium point for the system at 20 m/s
xe, ue = ct.find_eqpt(vehicle, 20, u0=[0, 4, 0], iu=[1, 2], y0=20, iy=[0])

# Linearized dynamics
vehicle_lin = vehicle.linearize(
    xe, ue, inputs=vehicle.input_labels, outputs=vehicle.output_labels)

# Controller: PI + antiwindup
ctrl_params = {'kp': 0.5, 'ki': 0.1, 'kaw': 2}

def ctrl_update(t, x, u, params):
    e = u[1] - u[0]                     # v - vref
    v_nom = -params['kp'] * e + x[0]    # nominal control input (PI)
    v_sat = np.clip(v_nom, 0, 1)        # clipped control input
    return -params['ki'] * e + params['kaw'] * (v_sat - v_nom)

def ctrl_output(t, x, u, params):
    e = u[1] - u[0]                     # v - vref
    v_nom = -params['kp'] * e + x[0]    # nominal control input (PI)
    v_sat = np.clip(v_nom, 0, 1)        # clipped control input
    return v_sat

ctrl = ct.nlsys(
    ctrl_update, ctrl_output, states=1, name='ctrl',
    inputs=['vref', 'v'], outputs='u', params=ctrl_params)

# Full system (linear and nonlinear)
nlsys = ct.interconnect(
    [vehicle, ctrl], inputs=['vref', 'gear', 'theta'], outputs=['v', 'u'])

lnsys = ct.interconnect(
    [vehicle_lin, ctrl], inputs=['vref', 'gear', 'theta'], outputs=['v', 'u'])

# Compute system response: flat then a hill
T1 = np.linspace(0, 5, 40)      # Flat section
T2 = np.linspace(5, 30)         # Hill section

# Nonlinear response
nl_resp1 = ct.input_output_response(nlsys, T1, [20, 4, 0], X0=[20, ue[0]])
nl_resp2a = ct.input_output_response(
    nlsys, T2, [20, 4, 0.07], X0=nl_resp1.states[:, -1])
nl_resp2b = ct.input_output_response(
    nlsys, T2, [20, 4, 0.105], X0=nl_resp1.states[:, -1])

# Linear response
ln_resp1 = ct.input_output_response(lnsys, T1, [20, 4, 0], X0=[20, ue[0]])
ln_resp2a = ct.input_output_response(
    lnsys, T2, [20, 4, 0.07], X0=ln_resp1.states[:, -1])
ln_resp2b = ct.input_output_response(
    lnsys, T2, [20, 4, 0.105], X0=ln_resp1.states[:, -1])

# Plot the velocity response
fig, axs = plt.subplots(2, 1, figsize=[3.4, 3.4], sharex=True)

axs[0].plot(nl_resp1.time, nl_resp1.outputs[0], 'b')
axs[0].plot(nl_resp2a.time, nl_resp2a.outputs[0], 'b')
axs[0].plot(nl_resp2b.time, nl_resp2b.outputs[0], 'b')

axs[0].plot(ln_resp2a.time, ln_resp2a.outputs[0], 'r--')
axs[0].plot(nl_resp2b.time, ln_resp2b.outputs[0], '--')

axs[0].axis([0, 30, 18.5, 20.5])
axs[0].set_yticks([19, 20])
axs[0].set_ylabel("Velocity $v$ [m/s]")

# Plot the throttle command
axs[1].plot(nl_resp1.time, nl_resp1.outputs[1], 'b')
axs[1].plot(nl_resp2a.time, nl_resp2a.outputs[1], 'b')
axs[1].plot(nl_resp2b.time, nl_resp2b.outputs[1], 'b')

axs[1].plot(ln_resp2a.time, ln_resp2a.outputs[1], 'r--')
axs[1].plot(nl_resp2b.time, ln_resp2b.outputs[1], '--')

axs[1].set_title(" ")           # Hack to adjust spacing between plots
axs[1].set_ylim([0, 1.25])
axs[1].set_yticks([0, 0.5, 1])
axs[1].set_yticklabels(["0", "0.5", "1"])
axs[1].set_ylabel("Throttle $u$")
axs[1].set_xlabel("Time $t$ [s]")

fbs.savefig('figure-6.14-cruise_linearized.png')


