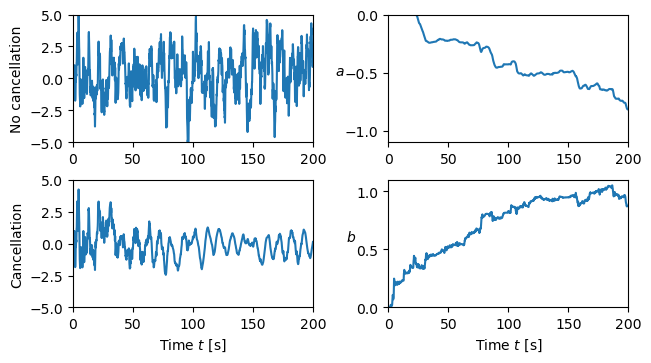
Figure 5.21: Simulation of noise cancellation
Jump to navigation
Jump to search
| Chapter | Dynamic Behavior |
|---|---|
| Figure number | 5.21 |
| Figure title | Simulation of noise cancellation |
| GitHub URL | https://github.com/murrayrm/fbs2e-python/blob/main/example-5.18-noise cancel.py |
| Requires | python-control |
Figure 5.21: Simulation of noise cancellation. The upper left figure shows the headphone signal without noise cancellation, and the lower left figure shows the signal with noise cancellation. The right figures show the parameters and of the filter.
# example-5.18-noise_cancel.py - Noise cancellation
# RMM, 24 Nov 2024
#
# Figure 5.21: Simulation of noise cancellation. The upper left figure
# shows the headphone signal without noise cancellation, and the lower left
# figure shows the signal with noise cancellation. The right figures show
# the parameters a and b of the filter.

import control as ct
import numpy as np
import matplotlib.pyplot as plt
from math import pi
ct.use_fbs_defaults()

#
# System dynamics
#

# Headphone dynamics
headphone_params = {'a0': -0.75, 'b0': 0.9}
def headphone_update(t, z, n, params):
    return params['a0'] * z[0] + params['b0'] * n[0]
headphone = ct.nlsys(
    headphone_update, inputs='n', states='z', params=headphone_params,
    name='headphone')

# Filter dynamics
def filter_update(t, w, u, params):
    n, a, b = u
    return a * w + b * n
filter = ct.nlsys(
    filter_update, inputs=['n', 'a', 'b'], states='w', name='filter')

# Controller dynamics
control_params = {'alpha': 1}
def control_update(t, x, u, params):
    n, e, w = u
    a, b = x
    return [
        params['alpha'] * w * e,
        params['alpha'] * n * e
    ]
control = ct.nlsys(
    control_update, inputs=['n', 'e', 'w'], states=['a', 'b'], name='control',
    params=control_params)

# Create summing junction to add all of the signal together
summer = ct.summing_junction(inputs=['z', 'S', '-w'], outputs='e')

# Interconnected system
sys = ct.interconnect(
    [headphone, filter, control, summer], name='noise_cancel',
    inputs=['S', 'n'], outputs=['e', 'a', 'b'])

# Create the signal and noise
timepts = np.linspace(0, 200, 2000)
signal = np.sin(0.1 * 2 * pi * timepts) # sinewave with frequency 0.1 Hz
noise = ct.white_noise(timepts, 5)      # white noise with covariance 5

# Set up the plotting grid to match the layout in the book
fig = plt.figure(constrained_layout=True)
gs = fig.add_gridspec(3, 2)

# No noise cancellation
resp_off = ct.input_output_response(
    sys, timepts, [signal, noise], params={'alpha': 0})

ax = fig.add_subplot(gs[0, 0])
ax.plot(resp_off.time, resp_off.outputs[0])
ax.axis('tight')
ax.axis([0, 200, -5, 5])
ax.set_ylabel("No cancellation")

resp_on = ct.input_output_response(
    sys, timepts, [signal, noise], params={'alpha': 1e-2})

ax = fig.add_subplot(gs[1, 0])
ax.plot(resp_on.time, resp_on.outputs[0], label='e')
# ax.plot(resp_on.time, signal, label='S')
ax.axis('tight')
ax.axis([0, 200, -5, 5])
ax.set_ylabel("Cancellation")
ax.set_xlabel("Time $t$ [s]")
# ax.legend()

ax = fig.add_subplot(gs[0, 1])
ax.plot(resp_on.time, resp_on.outputs[1])
ax.axis('tight')
ax.axis([0, 200, -1.1, 0])
ax.set_ylabel("$a$", rotation=0)

ax = fig.add_subplot(gs[1, 1])
ax.plot(resp_on.time, resp_on.outputs[2])
ax.axis('tight')
ax.axis([0, 200, 0, 1.1])
ax.set_ylabel("$b$", rotation=0)
ax.set_xlabel("Time $t$ [s]")

# Save the figure
plt.savefig("figure-5.21-noise_cancel.png", bbox_inches='tight')


